
Data loggers: analysis of impact, shock and vibration during transport
Data loggers record a variety of environmental conditions during transports, which are used for analysis. The interpretation of climate data such as temperature and humidity is not difficult, a familiar picture emerges for us. The situation is different when it comes to evaluating and analysing shocks, impacts or vibrations, which can have sometimes devastating consequences on sensitive goods in transit. We explain in more detail how to analyse and evaluate such undesirable accelerations and illustrate this with examples of ASPION shock sensors.
Mechanical-dynamic loads during transport
Every item to be transported is continually exposed to a mechanical-dynamic load. These loads result from the movement of the mode of transport (for example, a truck, a ship or a plane) and the packaging. The dynamic loads refer to x times the gravitational acceleration. The gravitational acceleration is a mathematical constant, which results from the formula 9,81 (~10) m / s² = 1 g. Depending on the means of transport used, a wide variety of g-forces can act on the cargo and these forces are responsible for the slippage of transport loads, the deformation of packages or the tearing off of entire containers on cargo ships.
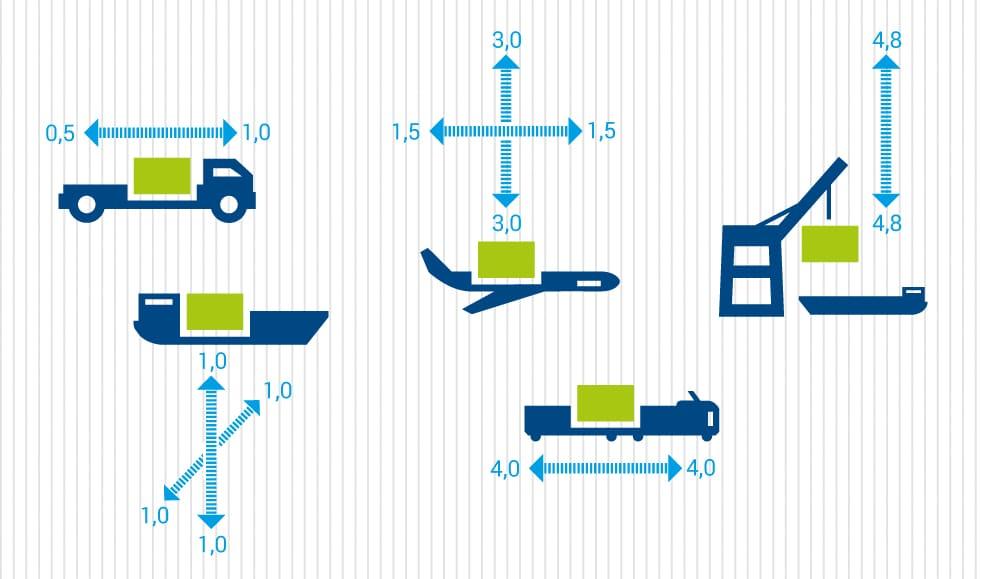
The graph shows an overview of mainly dynamic loads of different modes of transport as well as during transshipment in container shipping (values in g).
Evaluation of shocks: what information is essential?
How can shocks, impacts or vibrations on a transported good be assessed? On the one hand, the level of acceleration and, on the other hand, the duration of the shock are decisive. Here is an example: A truck is travelling at 50 km/h (~ 14 m/s) and collides with a rigid wall. Due to the impact, the truck comes to a standstill in 100 milliseconds, which corresponds to a (negative) acceleration of 140 m/s² or 14 g. As an example for the setting of impact recorders for event-triggered recording, according to DIN*, for example, 10 g for the duration of 5 ms is specified for potholes or 10 g for the duration of 20 ms for a shunting impact.
Data logger: analysis of impact, shock and vibration during transports
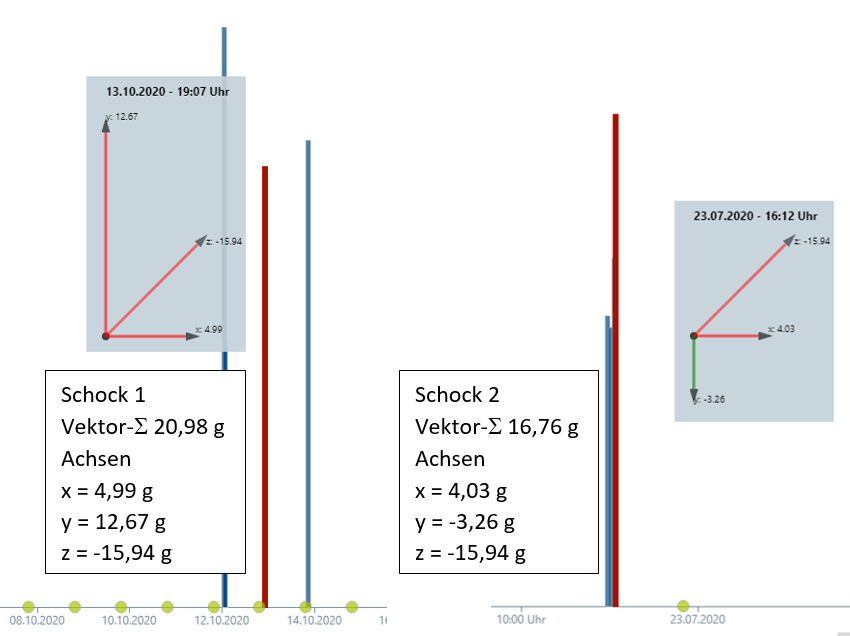
The logging of a shock / impact with an acceleration data logger is often displayed as vector sum and in the expression over three axes with direction indication. Below are two shocks - recorded with ASPION data loggers - with the following values:
If one evaluates the accelerations with vector sum and g-values of the axes, shock 2 appears lower than shock 1. However, this consideration still ignores the most important component: It is about the shock duration that acted on the object. In the example of the truck, this was 100 ms until the truck came to a standstill. With the shock details, the possible effects now become very concrete.
Shock curve in milliseconds provides insights
If each shock is analysed separately in milliseconds - shown with the ASPION G-Log Manager PC software for operating the shock sensors - it quickly becomes clear that the duration of a shock is shown in milliseconds, while the information on the maximum level of acceleration on the axes is recorded at exactly one point in time (red line).
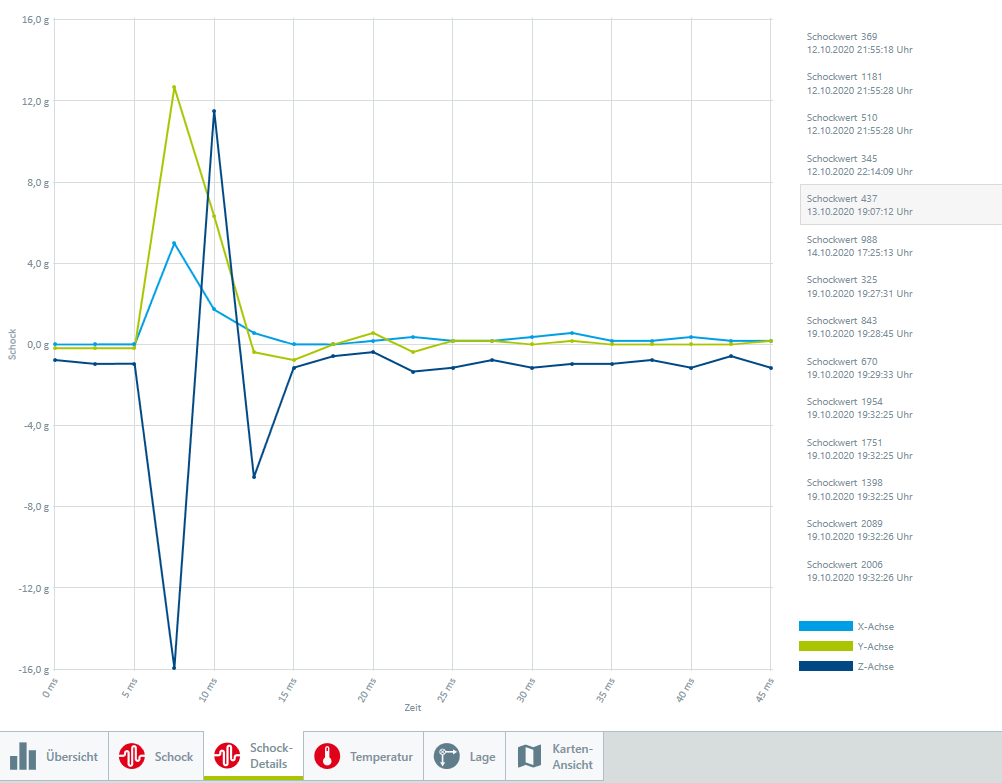
Shock 1 is of short duration: The accelerations in the z- and y-axes affect the transported goods over a duration of less than 10 ms. A typical process, for example, when setting down a load. Serious damage is not to be expected in this case.
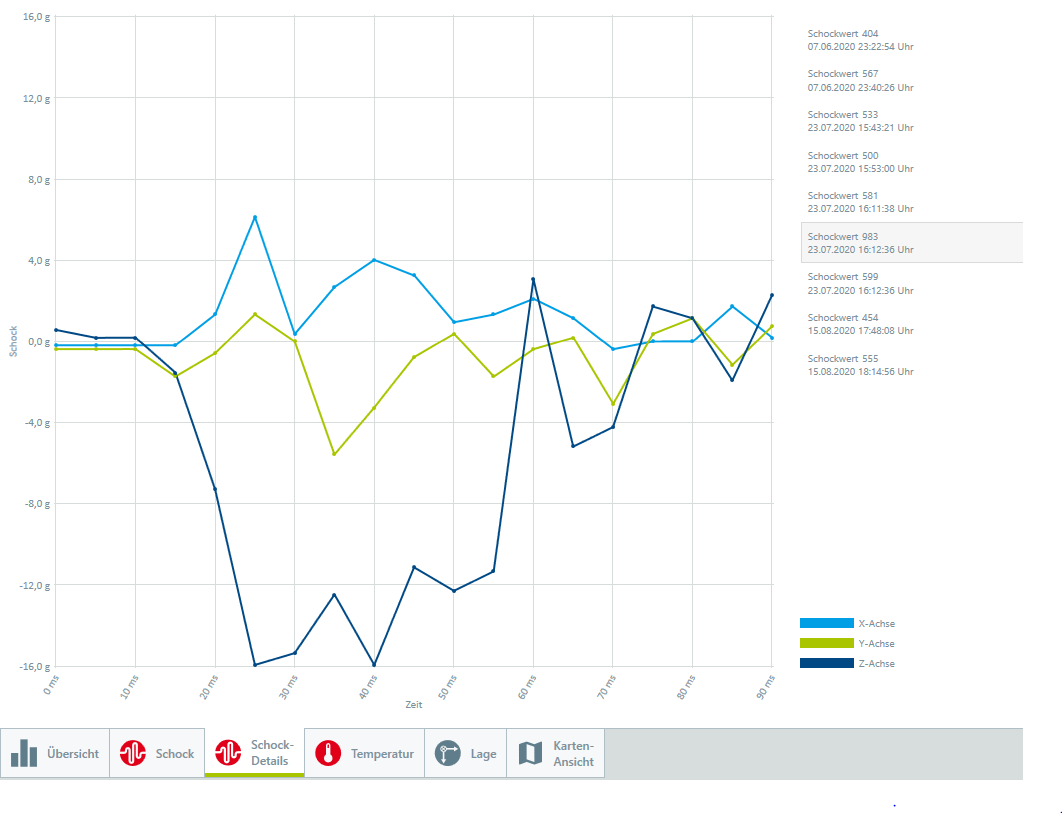
Shock 2 means that the impact lasts for a whole time: On the z-axis with an acceleration of almost 16 g and duration of about 60 ms, while x- and y-axis are involved with lower values. Such a curve progression almost certainly causes damage to the goods being transported.
Data logger Analysis of details: Detect vibrations and more
Clear indications of possible damage can be detected on curves. But also vibrations or, for example, typical air holes during air freight transport can be identified immediately from the shock details in the data logger analysis.
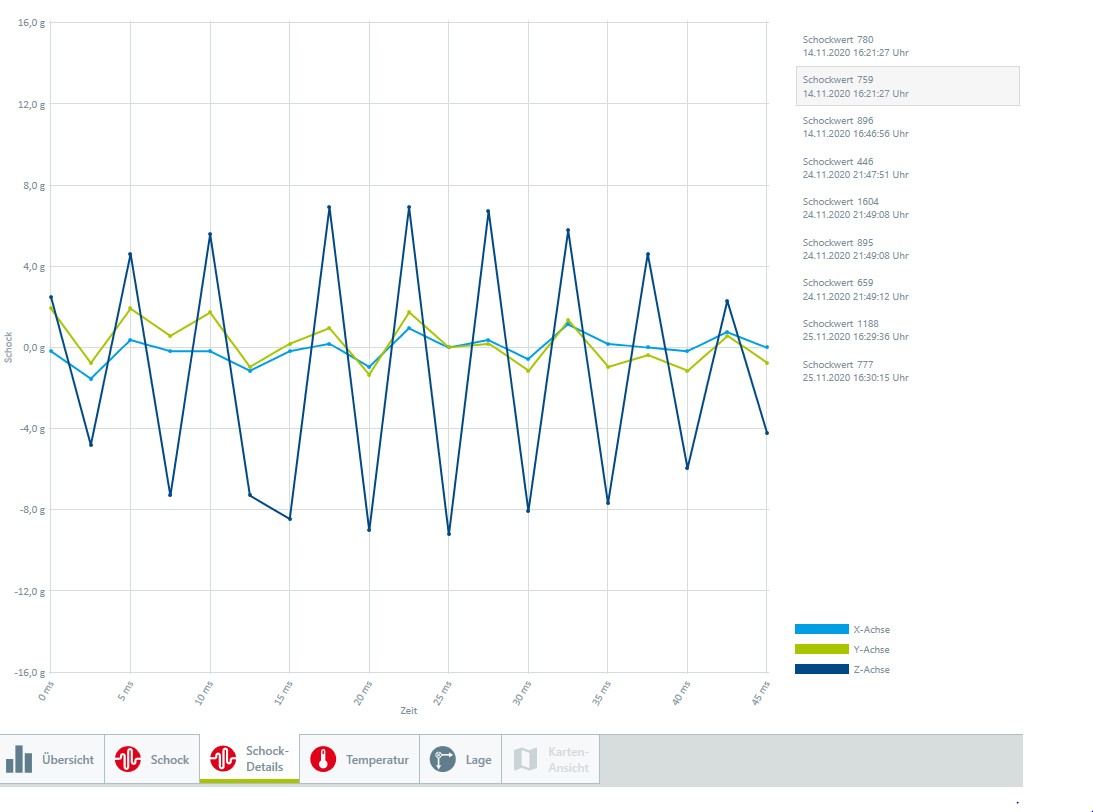
Vibrations follow a constant, recurring acceleration with a short duration in one direction: a typical process, for example, when pushing or pulling over a surface. If vibrations last longer, they are recorded in several shocks. In the case of extremely long-lasting or continuously recurring vibrations, such as those that occur during rail transport, screws can come loose or unwanted abrasion can occur.
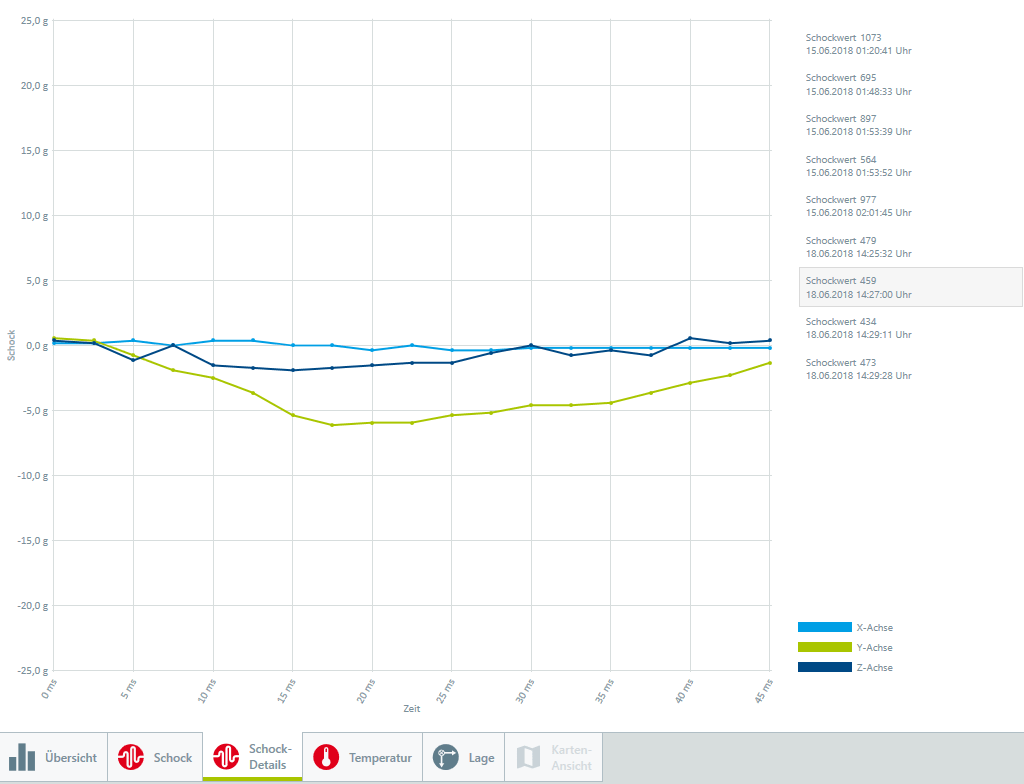
Shock details are also meaningful for air cargo transports: The axis pointing in the direction of the earth's gravitational pull indicates a prolonged shock load usually between 4 and 6 g. This is a typical sign of air holes in turbulence. Whether this is harmful to the goods being transported depends, of course, on the packaging on the one hand, and on the sensitivity of the goods being transported on the other. Turbulence lasting for minutes is logged in several successive shocks. The rather low accelerations acting on one axis are quickly comprehensible.
In order to be able to analyse the most important transport events with details, all ASPION data loggers have a separate memory area for shock details. An intelligent algorithm ensures that the very first shock and the other 8 highest shocks in the entire transport process are available for analysis in this level of detail. All further shocks or vibrations are reliably logged by the data loggers in the ring memory with their respective height and direction on all three axes. In addition, further data such as simple position visualisation or recorded climate values provide additional useful, usable information.
How do you detect serious damage? Explained in the short film!
By the way: You can download informative whitepapers on loads, acceleration, etc. from our customer portal.
We are happy to support you in the interpretation of your transport data! With our longstanding experience in the evaluation of transport events, you will gain important and informative insights into your transport processes and critical events. Contact us directly at any time.
DIN EN 15433-6:2008-02 Transportation loads - Measurement and evaluation of dynamic mechanical loads - Part 6: Automatic recording systems for measuring randomly occurring shock during monitoring of transports; German version EN 15433-6:2007

